So far this year, I’ve had the privilege of attending many #FlashHacks events, data liberation hackathons run by OpenCorporates, which runs the world’s largest open companies database. Attending #FlashHacks has brought me into contact with the world of corporate data, which isn’t something I would ever have considered or had contact with otherwise.
In our Data Journalism classes at City University, we’re taught how to scrape websites and social media networks to get at data; to look for stories in scraped or released data; to visualise data in a number of different ways. But we’ve never really needed to liberate data, that is comb the internet for data sources just for the sake of cataloguing them, or trawl through endless company files looking for connections. That work is more akin to Investigative Journalism than Data Journalism, but it’s also all about data and I think may become part of the everyday work of a data journalist as the data journalism and open journalism movements both advance.
Here’s what I’ve learned so far by dipping my toe into the world of corporate data.
LIBERATING DATA INVOLVES A LOT OF LEGWORK
This is true of all forms of data journalism, where stories can result from hours or even days of poring over spreadsheets, scraping data, cleaning data, looking for connections. But liberating data in particular is about 90% legwork, 10% payoff. #FlashHacks events are usually split into two sections, or teams; one team works on coding bots, which are programs that crawl over pdfs containing data and parse it into a human-readable format. One day I aspire to learn how to code a bot, but my coding background isn’t quite strong enough yet. It can take hours to push (run) a bot that will convert one pdf into a human-readable format, to say nothing of actually doing anything with the data.
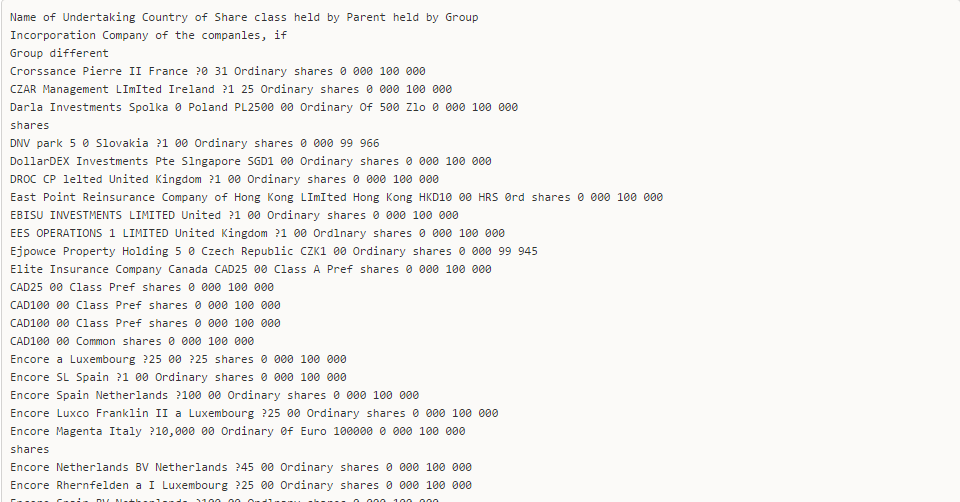
Then again, the non-bot method of liberating data is even longer. It involves simply trawling through pdfs, registers and other places which house company data, finding what’s relevant and inputting it manually into a huge spreadsheet, from which the data can be visualised and connections can be found. At past #FlashHacks, we’ve made finding data sources into a competition, with a prize awarded to the person who can log the most entries on the group spreadsheet.
Liberating corporate data is best done collaboratively, in other words, with a group of people to share leads, divide up the work, and egg each other on.
CORPORATIONS WON’T MAKE IT EASY ON YOU
This one might not come as a surprise, but even here in the UK – which is considered a world leader in terms of making data accessible, thanks to Companies House – corporations don’t make it easy on the public to use their data. The vast majority of companies, for example, file their tax returns in PDF format, which as I’ve mentioned needs special measures before it can be easily edited and exported elsewhere. HM Revenue and Customs recommends that companies file their tax returns in the more readable XBRL format, which they could just as easily do, but the majority continue to publish in PDF format in spite of this.
You also need to know where to look, which again is why collaboration is a key part of liberating corporate data: recording good data sources and advising one another on where to look for the right documents. Data journalism can often seem like a solitary activity (though hopefully less so in the future when data skills are more commonplace and data journalists seen as less of a world apart from regular reporters), but liberating corporate data is always best done in groups (hence why #FlashHacks exists!)
VISUALISATION CAN BE A CHALLENGE (BUT A REWARDING ONE!)
Visualising data isn’t always possible or necessary when working with corporate data, but it can be a useful tool, for example in mapping companies and their connections to better understand their relationships. OpenCorporates uses an in-house visualisation tool called Octopus to visualise company connections.
This map was visualised after an evening’s hard graft at the most recent #FlashHacks event, and as you can see, it’s still far from complete. A company with as many different connections as Aviva PLC (and most multi-national corporations for that matter) can be extremely challenging to visualise and scrutinise, and any map of its connections would probably need to be interactive before it can be explored properly. It can also take a lot of work before any of the links and hierarchies begin to appear.
However, it’s extremely satisfying once it starts to come together, and visualisation can be the best way to get an overview of interlocking corporate networks like these – not to mention it looks cool!
IT’S LOADS OF FUN!
This might seem odd to say after everything I’ve listed here, but I find #FlashHacks events really, really fun. I enjoy working in a group towards a larger goal, especially as that larger goal is one of social good which benefits everyone in the long run. I also love the sensation of being part of a greater movement towards open data, which is making some huge strides in 2016 in the UK with the creation of a centralised register of beneficial ownership (showing exactly who owns and controls what). It gives me the chance to work alongside other interested minds in the world of data and go “behind the scenes” with data in a way I normally wouldn’t as a journalist.
Also, the free snacks are a big bonus!
If all this sounds like your cup of tea as well, head on over to Meetup and join us!
You can also read my interview with Hera Hussain, organiser of #FlashHacks events, about the need for open data and the role of journalists in the open data movement, on the Interhacktives website.


